MediaHub was A.ki's self-service retail-media platform for second-tier brands and retailers. I designed two of its core surfaces — a year-round campaign calendar and a unified campaign-analytics dashboard — turning scattered planning files and inconsistent reports into one source of truth.

Product
Web app (desktop-first)
Domain
MarTech
Client
Role
Product Designer
Activities
Metrics
Brand teams ran retail-media campaigns out of isolated views, manual spreadsheets, and scattered, inconsistent analytics. That made two everyday jobs painful: planning a whole year of promotions, and quickly judging whether a campaign actually worked.
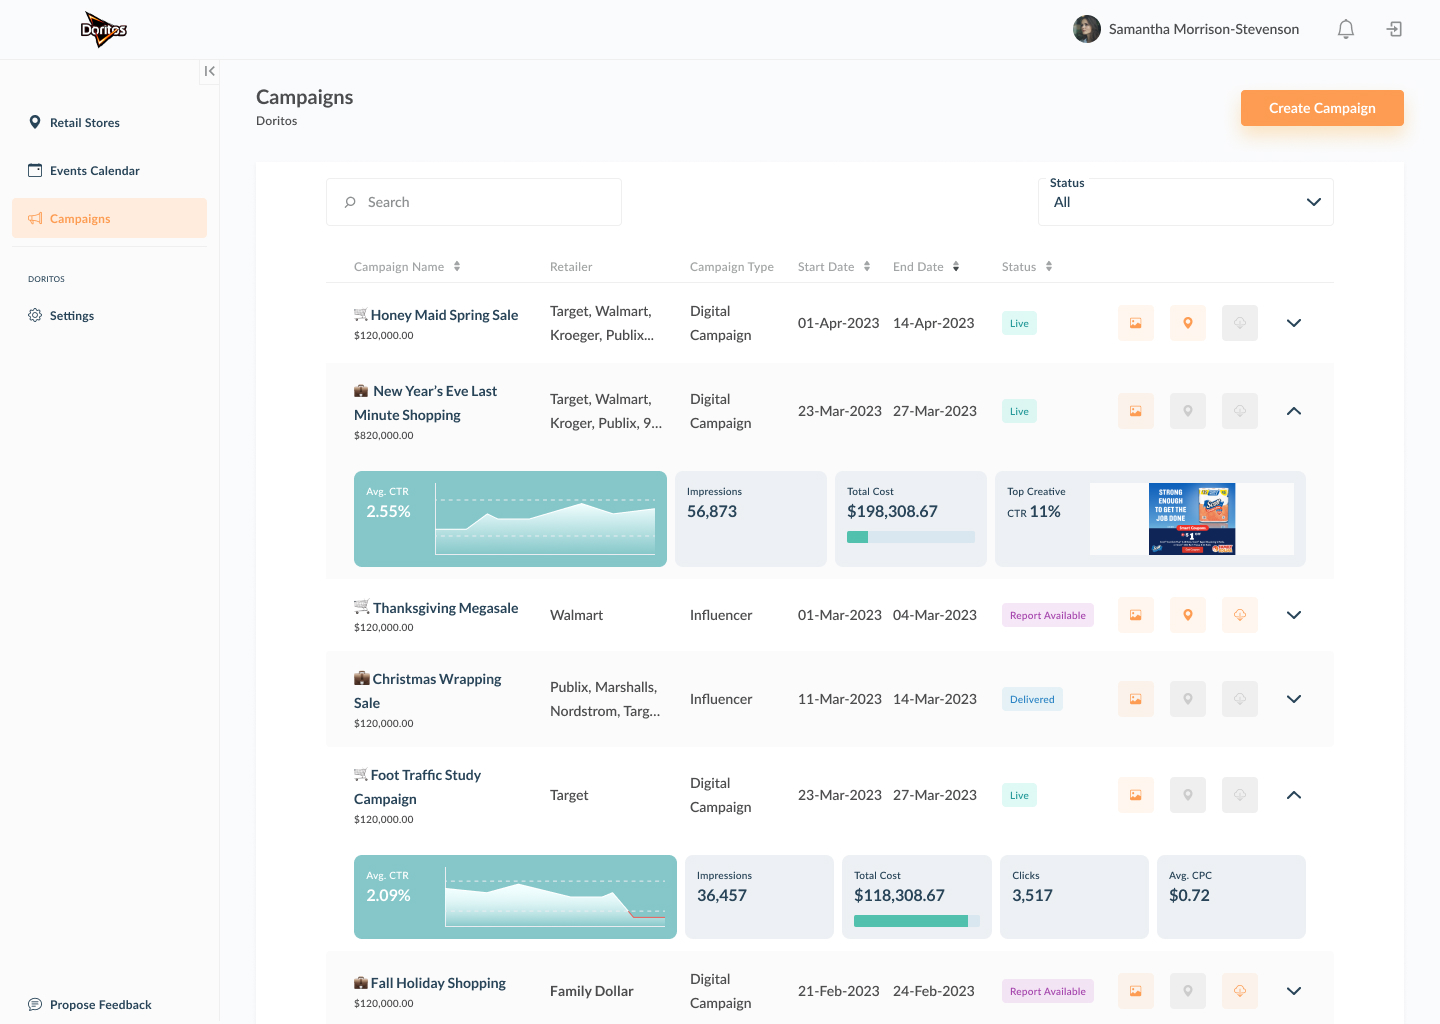
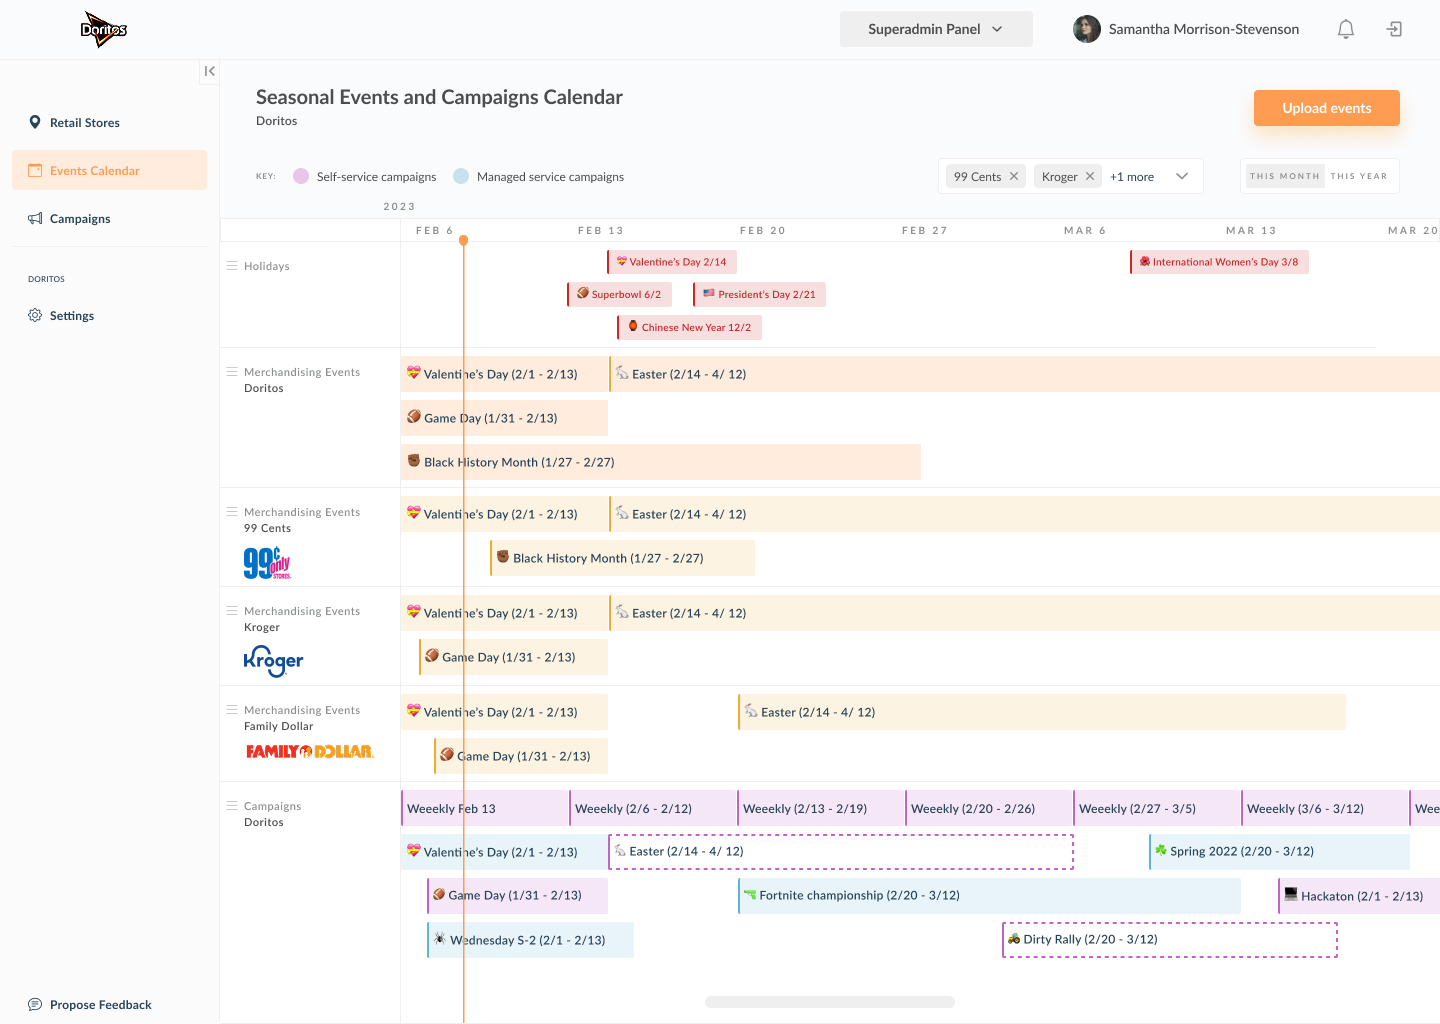
I designed a Gantt-style campaign calendar — grouping by retailer, channel or brand, with seasonality and holiday toggles and spreadsheet import — and a unified analytics dashboard, with charts restructured around the decision flow (reach → engagement → conversions). Both were validated with users and built in close collaboration with the analytics team to keep every metric accurate.
Together the two surfaces replaced static planning files and fragmented reports with one dynamic source of truth. Prototype validation reached 92% task success and 4.7/5 satisfaction; stakeholders interpreted results ~35% faster, and client follow-up questions dropped noticeably.
Brand teams now can see a full year of promotions in one place — seasonality, holidays, and live campaigns. It supports import from spreadsheets (for an easy kickstart), extensions for corporate programs and grouping by various axis.
Campaign data lived in several inconsistent views, so clients and managers struggled to judge success quickly. I unified every metric into one dashboard, restructured the chart hierarchy around the decision flow (reach → engagement → conversions), working with analysts to ensure accuracy.